Gallery of Charts
Examples of how to use the algorithms included in Cognite Charts.
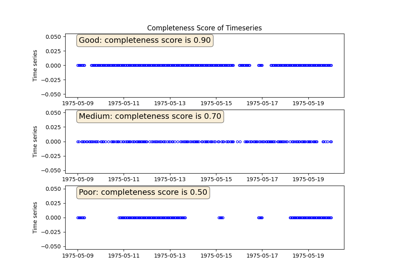
Data quality
Examples on how to explore the data quality of time series.
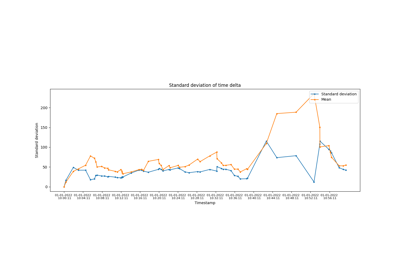
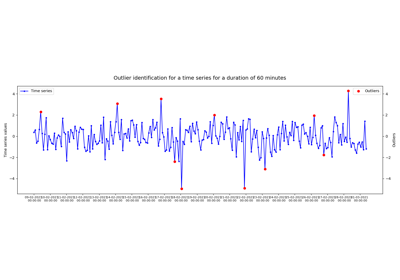
Rolling standard deviation of data points time delta
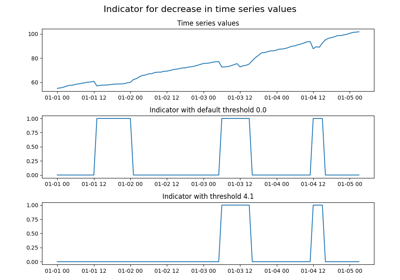
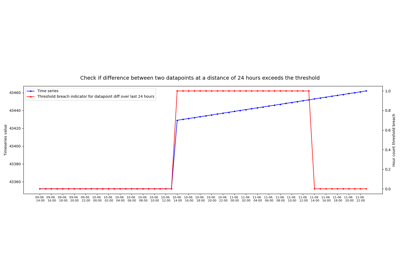
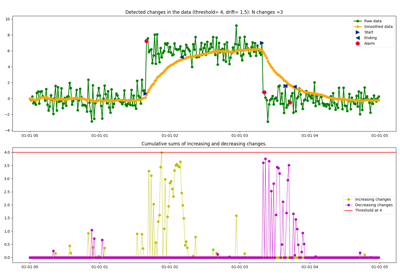
Threshold breach check for difference between two data points over a period of time
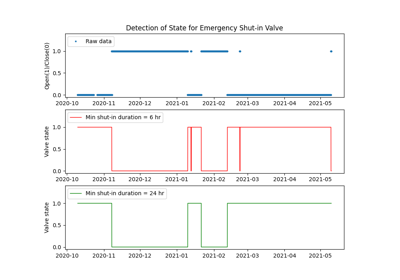
Detection Functions
Examples of how to use the detection functions included in Cognite Charts.
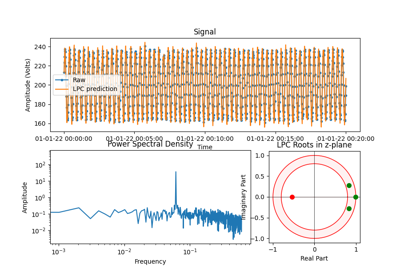
Oscillation detection using linear predictive coding
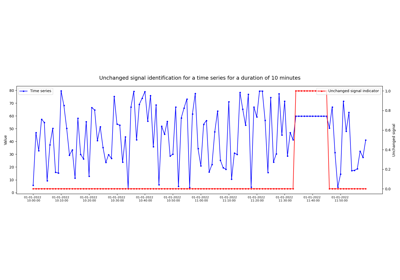
Unchanged signal identification of time series data
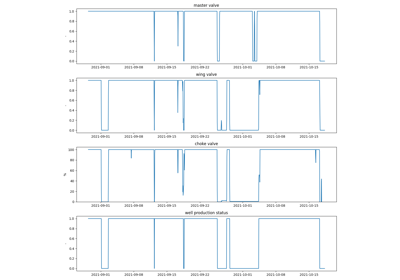
Equipment Functions
Examples of how to use the equipment functions included in Cognite Charts.

Filter Functions
Examples of how to use the filter functions included in Cognite Charts.
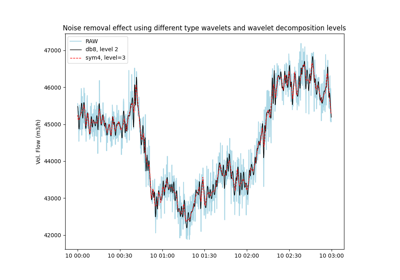
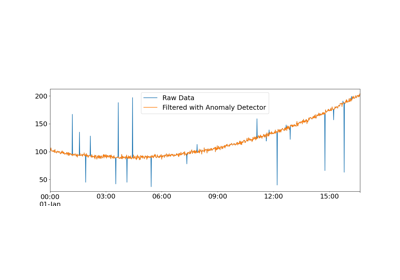
Noise removal and trending with the Wavelet filter
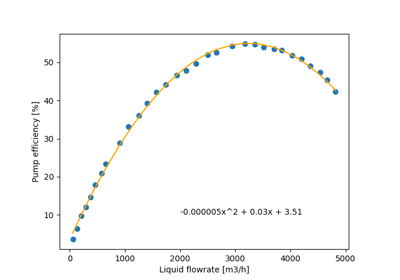
Fluid Dynamics
Examples on how to use the fluid dynamics functionality.

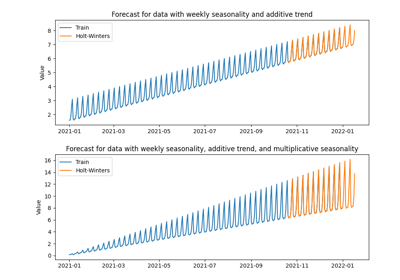
Forecasting Functions
Examples of algorithms used to forecast data
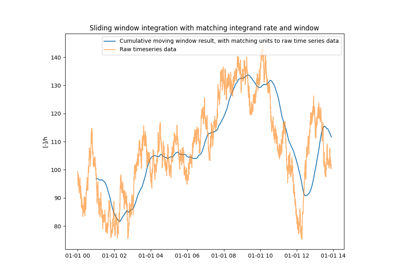
Numerical Calculus
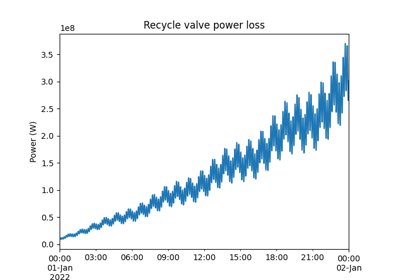
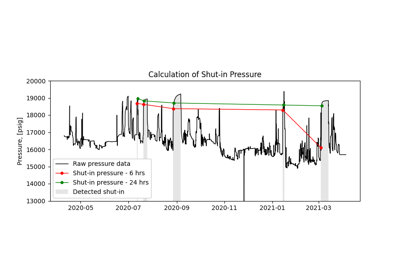
Oil and Gas Functions
Examples of algorithms used in the Oil and Gas industry.
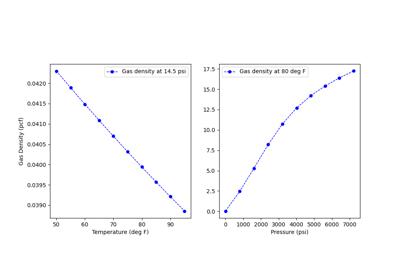
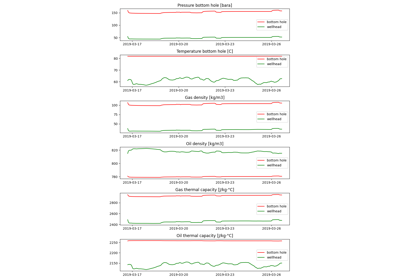
Calculate fluid properties given pressure and temperature
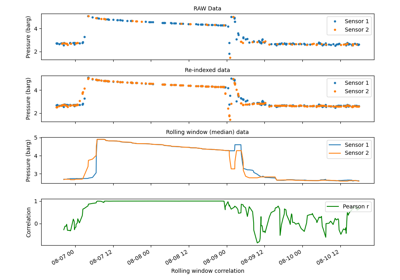
Reindex function
Example on how to reindex two time-series.
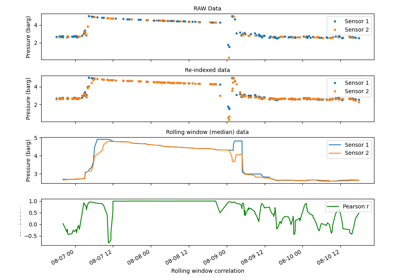
Re-indexing and compute Pearson correlation coefficient

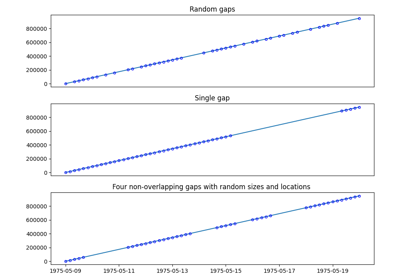
Resampling Functions
Examples of how to use the resampling functions included in Cognite Charts.
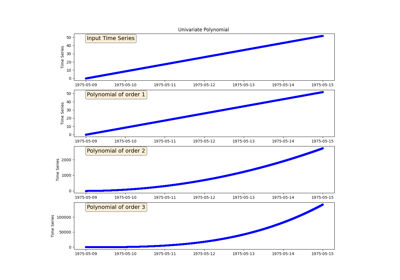
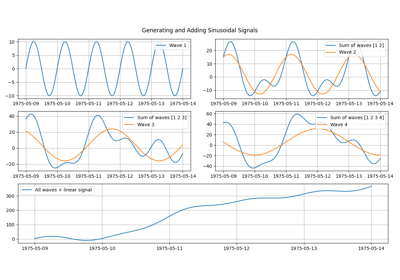
Synthetic Signal Generation
Examples of how to generate synthetic signals.
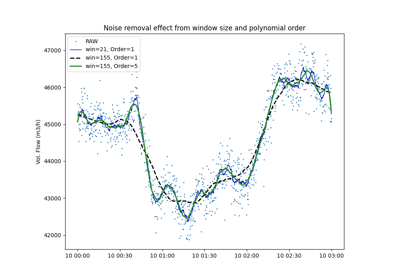
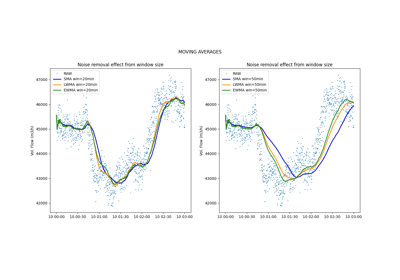
Smoothing Functions
Examples of how to use the smoothing functions included in Cognite Charts.
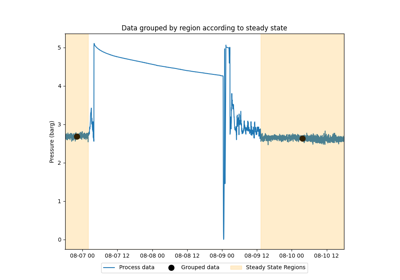
Statistics
Example on how to use statistics functions in InDSL.
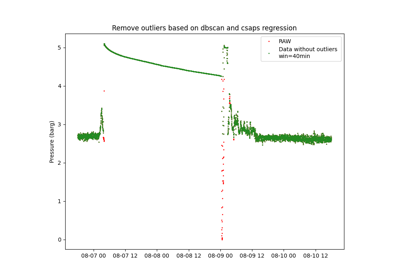
Outlier detection with DBSCAN and spline regression
Outlier detection with DBSCAN and spline regression 002
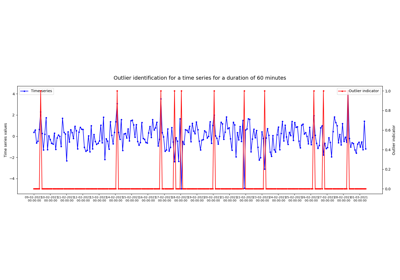
Outlier detection with DBSCAN and spline regression 001
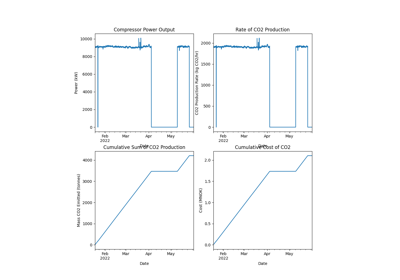
Sustainability Functions
Examples of how to use the sustainability functions.
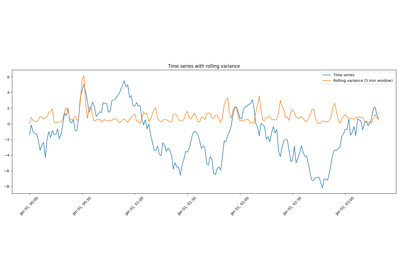
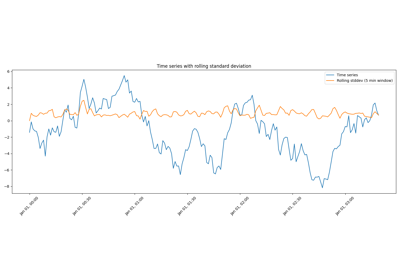
Rolling standard deviation and variance
Examples of rolling standard deviation and variance functions
Function versioning
Example on how to implement versions of a function in InDSL.
