Note
Go to the end to download the full example code.
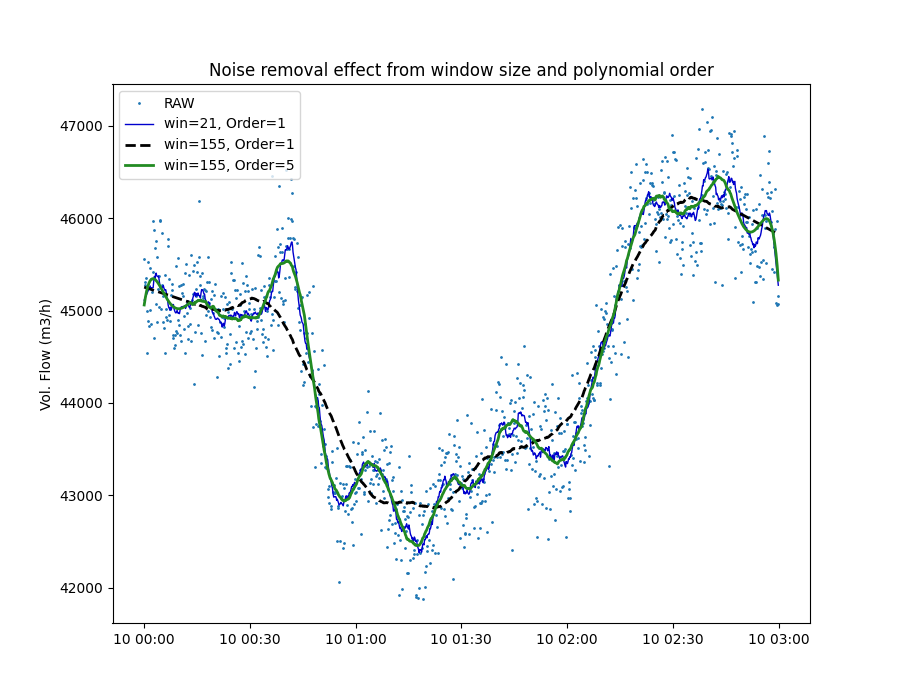
Data smoothing with the Savitzky-Golay filter
Example of noise removal from time series data using the Savitzky-Golay smoother. We use data from volumetric flow rate (m3/h) sensor with non-uniform sampling frequency measuring flow into a compressor.
In the figure below it can be observed how a small window size (win=21) and linear fit (order=1) exposes the trend and some of the noise (data fluctuations). Increasing the window size while keeping a linear fit results in a stronger smoothing of the data. However, increasing the order of the fit to 5 (non-linear fit) produced a nice and smooth trend while allowing the larger fluctuation through.
from pathlib import Path

import matplotlib.pyplot as plt
import pandas as pd

from indsl.smooth import sg


base_path = Path(__file__).parents[2] if "__file__" in globals() else next(p for p in (Path.cwd(), *Path.cwd().parents) if (p / "datasets").exists())
data = pd.read_csv(base_path / "datasets" / "data" / "vol_flow_rate_m3h.csv", index_col=0)
data = data.squeeze()
data.index = pd.to_datetime(data.index)
# TODO: Create load_flowrate_data method from above

# Apply the smoother with different settings and plot the results
plt.figure(1, figsize=[9, 7])
plt.plot(data, ".", markersize=2, label="RAW")
# Short window, order =1 (linear)
plt.plot(sg(data, window_length=21, polyorder=1), color="mediumblue", linewidth=1, label="win=21, Order=1")
# Long window, order =1 (linear)
plt.plot(sg(data, window_length=155, polyorder=1), color="k", linewidth=2, ls="--", label="win=155, Order=1")
# Long window, order =5 (non-linear)
plt.plot(sg(data, window_length=155, polyorder=5), color="forestgreen", linewidth=2, ls="-", label="win=155, Order=5")

plt.ylabel("Vol. Flow (m3/h)")
plt.title("Noise removal effect from window size and polynomial order")
_ = plt.legend(loc=2)

plt.show()
Total running time of the script: (0 minutes 0.103 seconds)