Note
Go to the end to download the full example code.
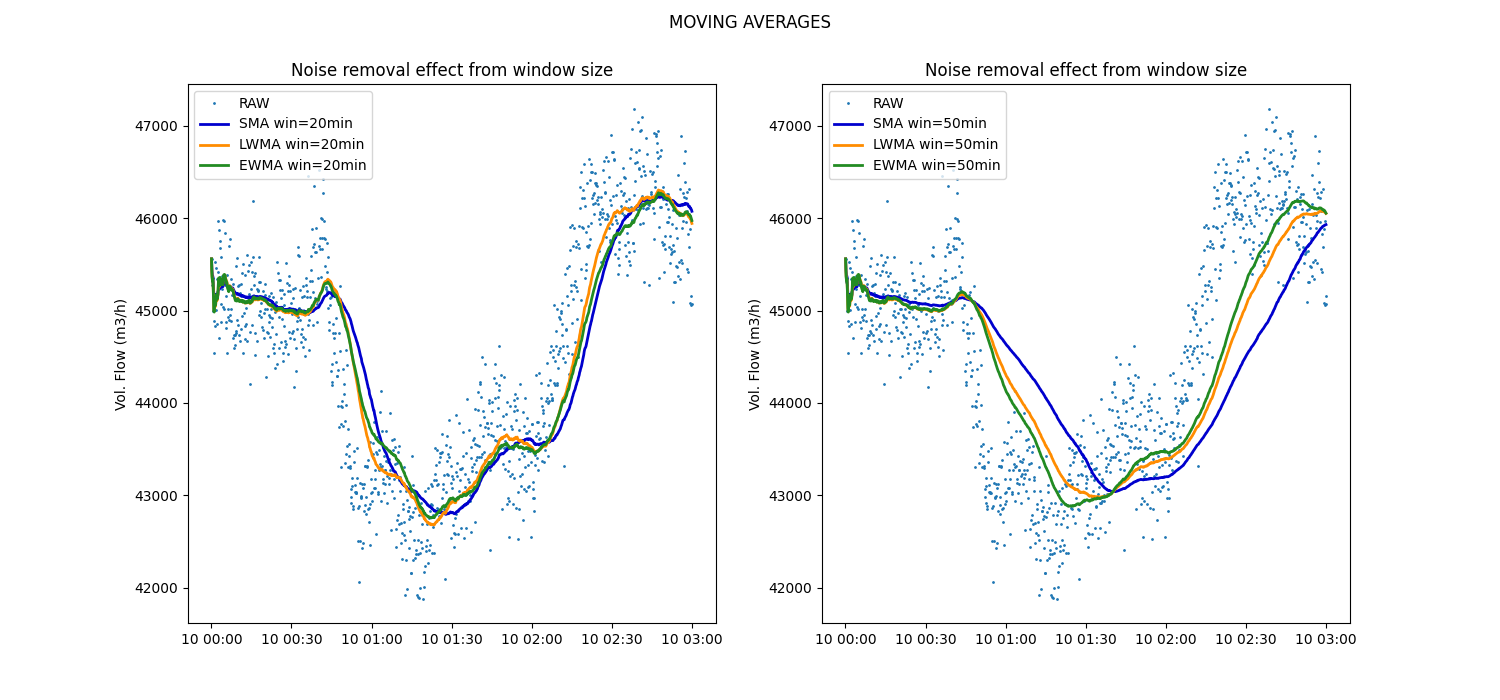
Data smoothing with Moving Averages
Example of noise removal from time series data using the Simple Moving Average (SMA), Linear Weighted Moving Average (LWMA) and Exponential Weighted Moving Average smoother (EWMA). We use data from volumetric flow rate (m3/h) sensor with non-uniform sampling frequency measuring flow into a compressor. In the figure below it can be observed that using SMA produces a less noisy time series, but changes in the trend are seen with a greater delay than LWMA or EWMA. Increasing the window size results in a stronger smoothing of the data.
from pathlib import Path

import matplotlib.pyplot as plt
import pandas as pd

from indsl.smooth import ewma, lwma, sma


base_path = Path(__file__).parents[2] if "__file__" in globals() else next(p for p in (Path.cwd(), *Path.cwd().parents) if (p / "datasets").exists())
data = pd.read_csv(base_path / "datasets" / "data" /"vol_flow_rate_m3h.csv", index_col=0)
data = data.squeeze()
data.index = pd.to_datetime(data.index)

_, axs = plt.subplots(1, 2, figsize=(15, 7))

# Calculate the different moving averages for a time window of 20min and plot the results
axs[0].plot(data, ".", markersize=2, label="RAW")
time_window = "20min"
axs[0].plot(
    sma(data, time_window=pd.Timedelta(time_window), min_periods=1),
    color="mediumblue",
    linewidth=2,
    label=f"SMA win={time_window}",
)
axs[0].plot(
    lwma(data, time_window=pd.Timedelta(time_window), min_periods=1),
    color="darkorange",
    linewidth=2,
    label=f"LWMA win={time_window}",
)
axs[0].plot(
    ewma(data, time_window=pd.Timedelta(time_window), min_periods=1),
    color="forestgreen",
    linewidth=2,
    label=f"EWMA win={time_window}",
)
axs[0].set_ylabel("Vol. Flow (m3/h)")
axs[0].set_title("Noise removal effect from window size")
_ = axs[0].legend(loc=2)

# Calculate the different moving averages for a time window of 50min and plot the results
axs[1].plot(data, ".", markersize=2, label="RAW")
time_window = "50min"
axs[1].plot(
    sma(data, time_window=pd.Timedelta(time_window), min_periods=1),
    color="mediumblue",
    linewidth=2,
    label=f"SMA win={time_window}",
)
axs[1].plot(
    lwma(data, time_window=pd.Timedelta(time_window), min_periods=1),
    color="darkorange",
    linewidth=2,
    label=f"LWMA win={time_window}",
)
axs[1].plot(
    ewma(data, time_window=pd.Timedelta(time_window), min_periods=1),
    color="forestgreen",
    linewidth=2,
    label=f"EWMA win={time_window}",
)
axs[1].set_ylabel("Vol. Flow (m3/h)")
axs[1].set_title("Noise removal effect from window size")
_ = axs[1].legend(loc=2)

_ = plt.suptitle("MOVING AVERAGES")
plt.show()
Total running time of the script: (0 minutes 1.061 seconds)