Note
Go to the end to download the full example code.
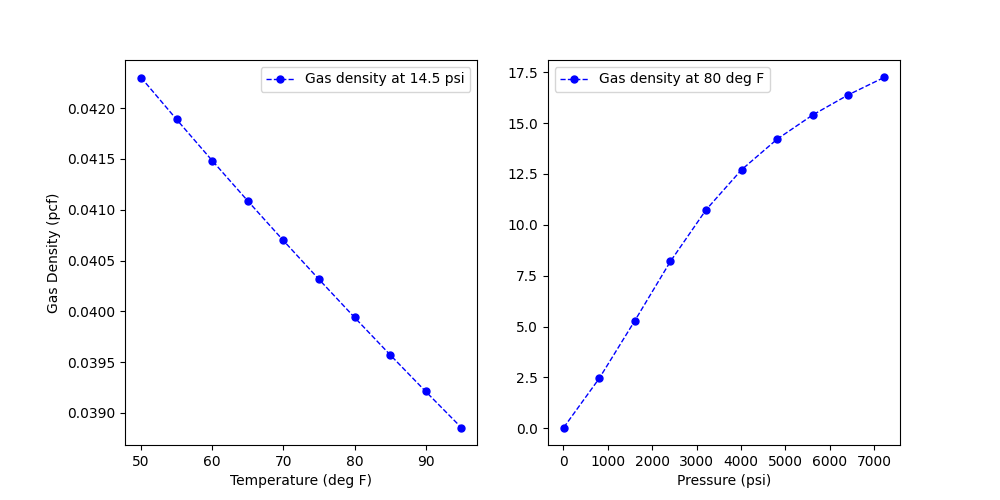
Calculation of gas density
Gas density is calculated using real gas equations from input pressure, temperature and specific gravity of gas. The compressibility factor is calculated explicitly (Beggs and Brill - 1973) for the pressure and temperature combinations. The plot shows the variation of the gas density for methane gas (SG = 0.55) with varying temperature and pressure.
from pathlib import Path

import matplotlib.pyplot as plt
import pandas as pd

from indsl.oil_and_gas.gas_density_calcs import calculate_gas_density as cd


# pressure and temperature series define
base_path = Path(__file__).parents[2] if "__file__" in globals() else next(p for p in (Path.cwd(), *Path.cwd().parents) if (p / "datasets").exists())
data = pd.read_csv(base_path / "datasets" / "data" / "density_pr_tmp.csv", index_col=0)
sg = pd.Series([0.5534])
fig, ax = plt.subplots(1, 2, figsize=[10, 5])

ax[0].plot(
    data["T_var (F)"],
    cd(data["P_con (psi)"], data["T_var (F)"], sg),
    color="blue",
    linestyle="dashed",
    linewidth=1,
    markersize=10,
    marker=".",
    label="Gas density at " + str(data.at[data.index[0], "P_con (psi)"]) + " psi",
)

ax[0].set_xlabel("Temperature (deg F)")
ax[0].set_ylabel("Gas Density (pcf)")
ax[0].legend()


ax[1].plot(
    data["P_var (psi)"],
    cd(data["P_var (psi)"], data["T_con (F)"], sg),
    color="blue",
    linestyle="dashed",
    linewidth=1,
    markersize=10,
    marker=".",
    label="Gas density at " + str(data.at[data.index[0], "T_con (F)"]) + " deg F",
)
ax[1].set_xlabel("Pressure (psi)")
ax[1].legend()

plt.show()
Total running time of the script: (0 minutes 0.119 seconds)