Note
Go to the end to download the full example code.
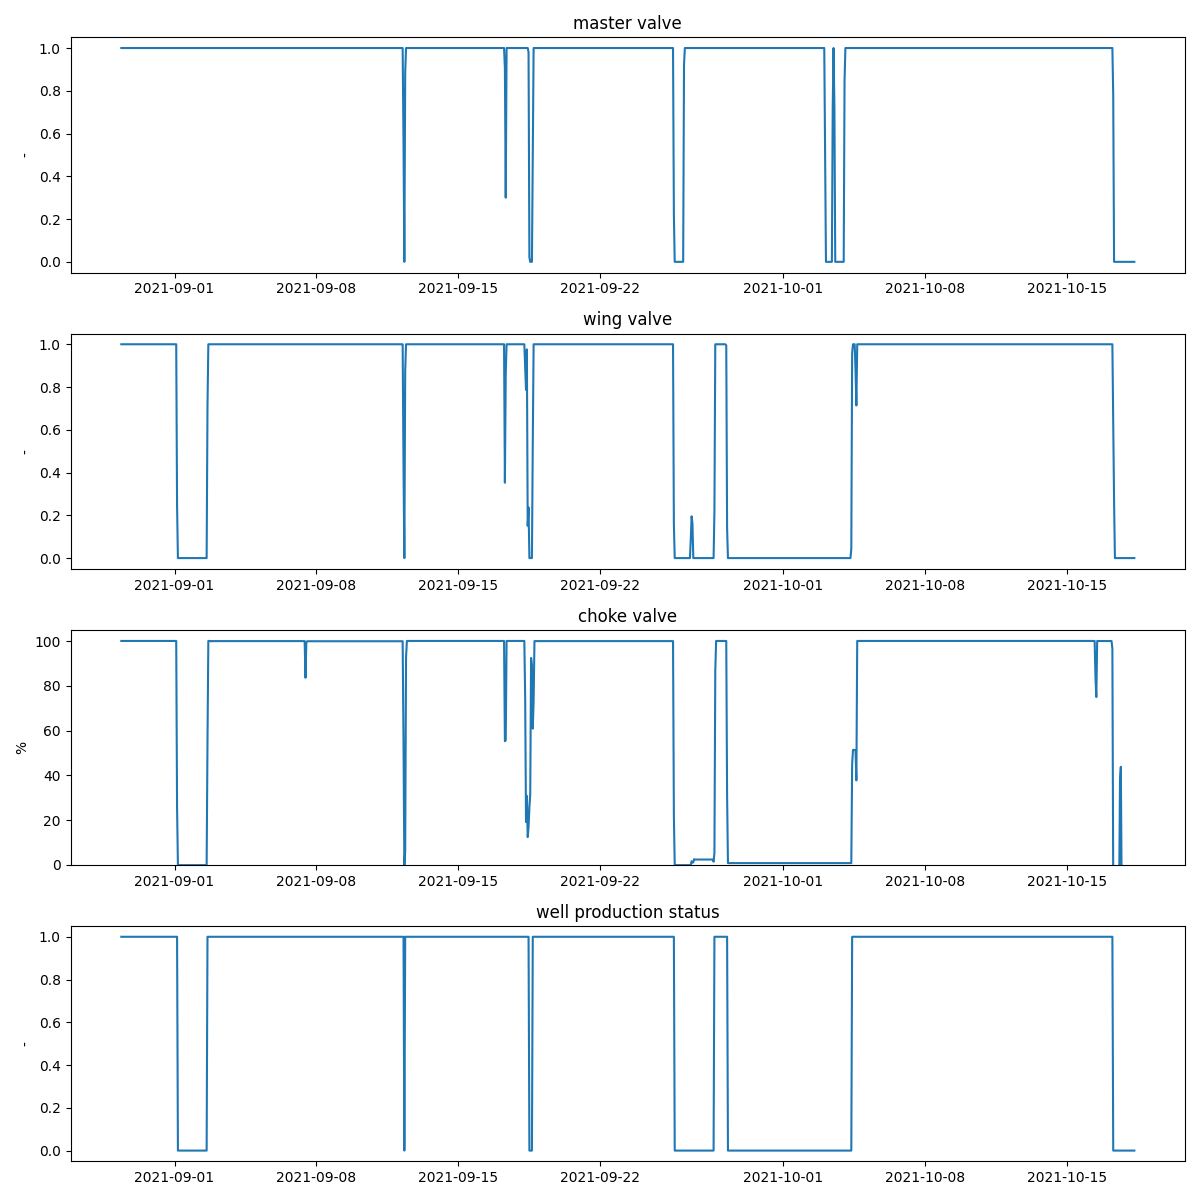
Check for the production status of a well
The data is from an unnamed well in the form of a pickle file. The data is a dataframe that consists of a time series of master, wing and choke valves. The duration of the data is about 50 days. The figure shows the time series of the valves and the output of the function which is the production status of the well (0 is OFF and 1 is ON).
from pathlib import Path

import matplotlib.pyplot as plt
import pandas as pd

from indsl.oil_and_gas.well_prod_status import calculate_well_prod_status


base_path = Path(__file__).parents[2] if "__file__" in globals() else next(p for p in (Path.cwd(), *Path.cwd().parents) if (p / "datasets").exists())
data = pd.read_pickle(base_path / "datasets" / "data" / "valve_data.pkl")

master = data.iloc[:, 0]
wing = data.iloc[:, 1]
choke = data.iloc[:, 2]

prod_status = calculate_well_prod_status(master, wing, choke, threshold_choke=5, threshold_master=1, threshold_wing=1)
names = ["master valve", "wing valve", "choke valve", "well production status"]
y_label = ["-", "-", "%", "-"]
y_lim_max = [1.05, 1.05, 105, 1.05]
y_lim_min = [-0.05, -0.05, -0.05, -0.05]

fig, ax = plt.subplots(figsize=(12, 12), nrows=4, ncols=1)
ax = ax.ravel()
for idx, i in enumerate([master, wing, choke, prod_status]):
    ax[idx].plot(i)
    ax[idx].set_title(names[idx])
    ax[idx].set_ylabel(y_label[idx])
    ax[idx].set_ylim(y_lim_min[idx], y_lim_max[idx])

plt.tight_layout()
plt.show()
Total running time of the script: (0 minutes 0.408 seconds)