Note
Go to the end to download the full example code.
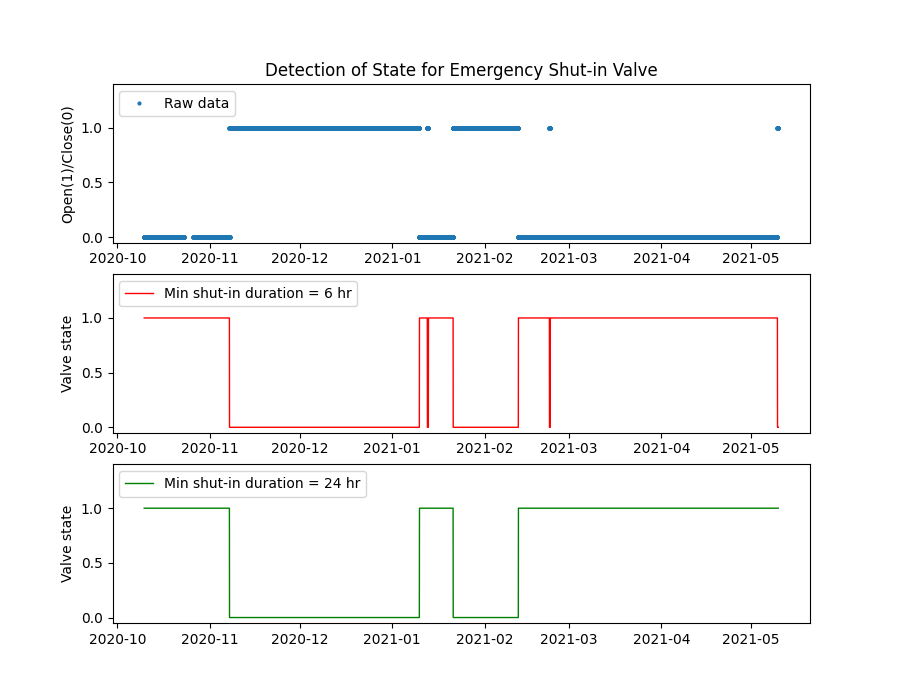
Detection of valve shut-in state
We use data from an emergency shut-down valve sensor on a compressor. The figure shows reading from the valve and the detected open/close state for shut-in durations of at least 6 and 24 hours in duration.
from pathlib import Path

import matplotlib.pyplot as plt
import pandas as pd

from indsl.oil_and_gas.shut_in_detector import calculate_shutin_interval as shi

base_path = Path(__file__).parents[2] if "__file__" in globals() else next(p for p in (Path.cwd(), *Path.cwd().parents) if (p / "datasets").exists())
data = pd.read_csv(base_path / "datasets" / "data" / "shut_down_valve.csv", index_col=0)
data = data.squeeze()
data.index = pd.to_datetime(data.index)
# TODO: Create load_shutin_valve_data method from above

# Apply the shut-in detector with different settings and plot the results
fig, ax = plt.subplots(3, 1, figsize=[9, 7])
ax[0].plot(data, "o", markersize=2, label="Raw data")
# Short shut-in (default of 6 hrs), shut-in state is when the value is greater than threshold
ax[1].plot(
    shi(data, shutin_state_below_threshold=False),
    color="red",
    linewidth=1,
    label="Min shut-in duration = 6 hr",
)
# Long shut-in (24 hrs), shut-in state is when the value is greater than threshold
ax[2].plot(
    shi(data, min_shutin_len=24, shutin_state_below_threshold=False),
    color="green",
    linewidth=1,
    label="Min shut-in duration = 24 hr",
)
ax[0].set_ylabel("Open(1)/Close(0)")
ax[0].set_title("Detection of State for Emergency Shut-in Valve")
ax[1].set_ylabel("Valve state")
ax[2].set_ylabel("Valve state")
plt.setp(ax, ylim=[-0.05, 1.4])
_ = ax[0].legend(loc=2)
_ = ax[1].legend(loc=2)
_ = ax[2].legend(loc=2)
plt.show()
Total running time of the script: (0 minutes 0.200 seconds)