Note
Go to the end to download the full example code.
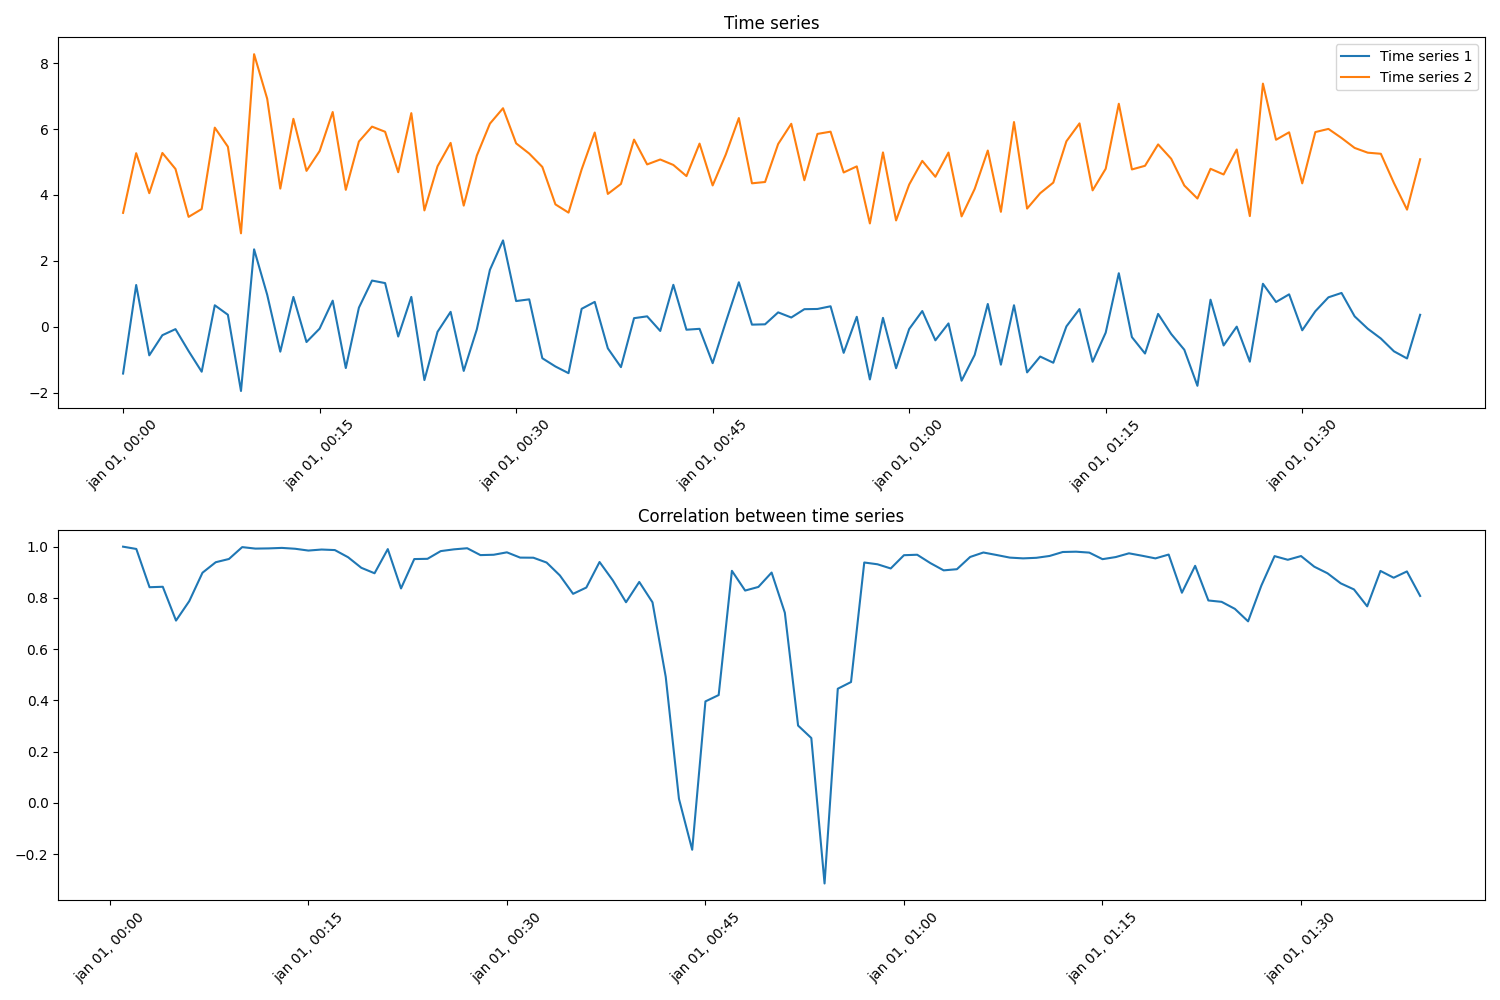
Pearson correlation
This example calculates the rolling pearson correlation coefficient between two synthetic timeseries.
import matplotlib.pyplot as plt
import numpy as np
import pandas as pd

from matplotlib.dates import DateFormatter

from indsl.statistics.correlation import pearson_correlation


# generate the data
rng = np.random.default_rng(12345)
num_datapoints = 100
y1 = rng.standard_normal(num_datapoints)
y2 = y1.copy()  # create data2 from data1
y2 += 5  # add deviation
y2 += rng.standard_normal(num_datapoints) * 0.5  # add noise
index = pd.date_range(start="1970", periods=num_datapoints, freq="1min")
data1, data2 = pd.Series(y1, index=index), pd.Series(y2, index=index)

# calculate the rolling pearson correlation
corr = pearson_correlation(data1, data2, time_window=pd.Timedelta(minutes=5), min_periods=1)

# Plot the two time series and the correlation between them
fig, ax = plt.subplots(2, 1, figsize=[15, 10])
ax[0].plot(
    data1,
    label="Time series 1",
)
ax[0].plot(data2, label="Time series 2")
ax[1].plot(corr, label="Rolling pearson correlation")
ax[0].set_title("Time series")
ax[1].set_title("Correlation between time series")
_ = ax[0].legend(loc="best")

# Formatting
myFmt = DateFormatter("%b %d, %H:%M")
for ax_ in ax:
    ax_.xaxis.set_major_formatter(myFmt)
    ax_.xaxis.set_major_formatter(DateFormatter("%b %d, %H:%M"))
    _ = plt.setp(ax_.get_xticklabels(), rotation=45)
plt.tight_layout()
plt.show()
Total running time of the script: (0 minutes 0.267 seconds)