Note
Go to the end to download the full example code.
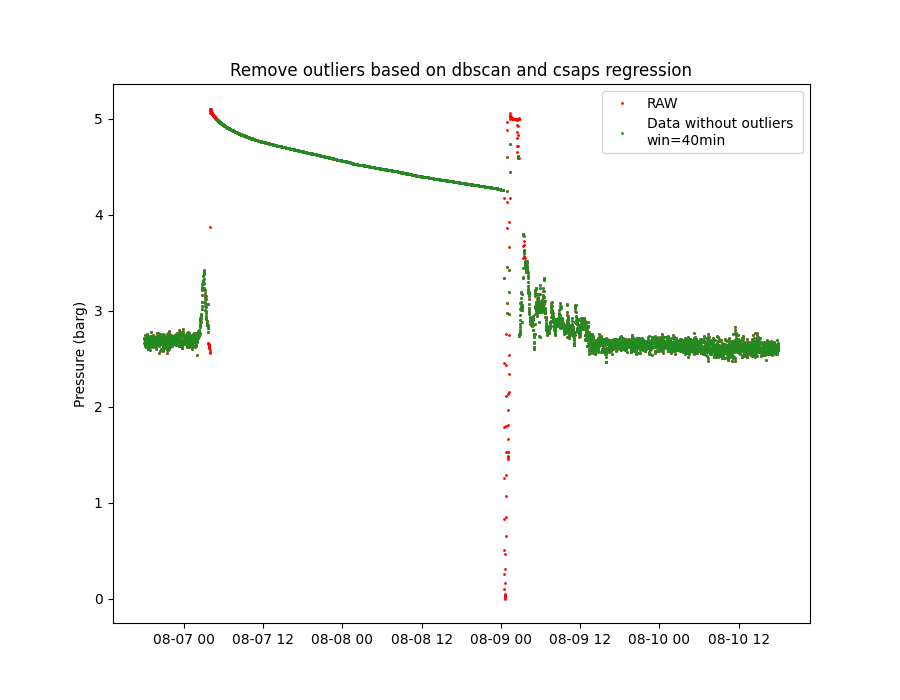
Outlier detection with DBSCAN and spline regression
Example of outlier detection from time series data using DBSCAN and spline regression. We use data from a compressor suction pressure sensor. The data is in barg units and resampled to 1 minute granularity. The figure shows the data without outliers considering a time window of 40min.
from pathlib import Path

import matplotlib.pyplot as plt
import pandas as pd

from indsl.statistics import remove_outliers


# TODO: USe a better data set to show how the outlier removal. Suggestion, use a synthetic data set.


base_path = Path(__file__).parents[2] if "__file__" in globals() else next(p for p in (Path.cwd(), *Path.cwd().parents) if (p / "datasets").exists())
data = pd.read_csv(base_path / "datasets" / "data" / "suct_pressure_barg.csv", index_col=0)
data = data.squeeze()
data.index = pd.to_datetime(data.index)

plt.figure(1, figsize=[9, 7])
plt.plot(data, ".", markersize=2, color="red", label="RAW")

# Remove the outliers with a time window of 40min and plot the results
plt.plot(
    remove_outliers(data, time_window=pd.Timedelta("40min")),
    ".",
    markersize=2,
    color="forestgreen",
    label="Data without outliers \nwin=40min",
)

plt.ylabel("Pressure (barg)")
plt.title("Remove outliers based on dbscan and csaps regression")
_ = plt.legend(loc=1)
plt.show()
Total running time of the script: (0 minutes 1.140 seconds)