Note
Go to the end to download the full example code.
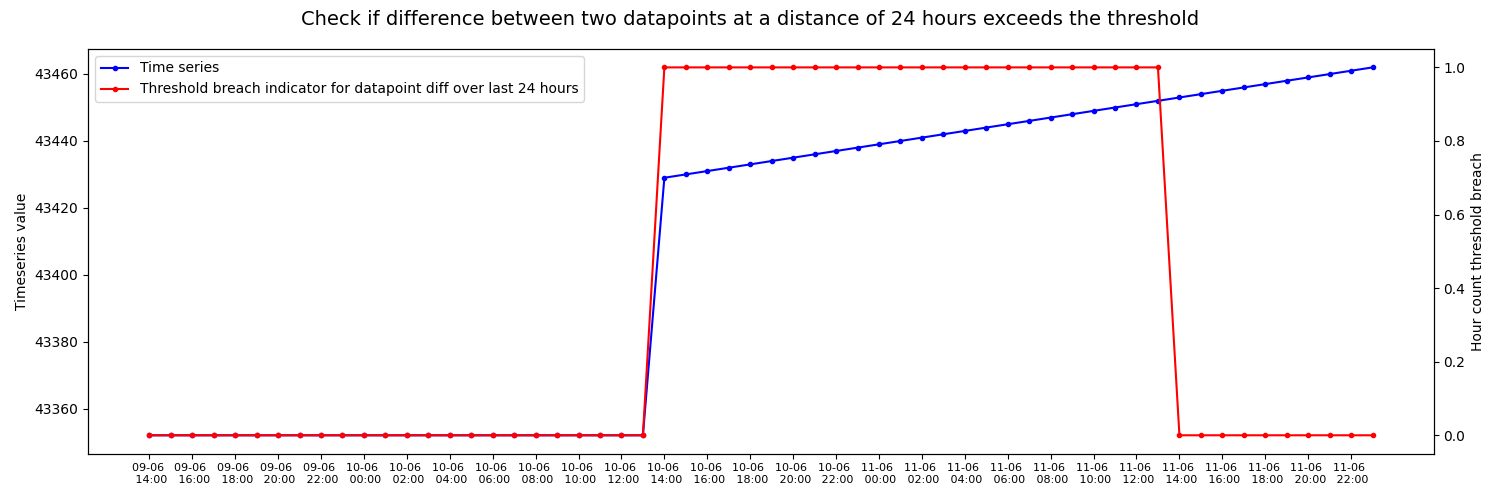
Threshold breach check for difference between two data points over a period of time
Example of visualizing breach of threshold in hour count in a time series representing running hours of a piece of equipment.
from pathlib import Path

import matplotlib.pyplot as plt
import pandas as pd

from indsl.data_quality.datapoint_diff import datapoint_diff_over_time_period


# import generated data
base_path = Path(__file__).parents[2] if "__file__" in globals() else next(p for p in (Path.cwd(), *Path.cwd().parents) if (p / "datasets").exists())
data = pd.read_csv(base_path / "datasets" / "data" / "hour_count.csv", index_col=0)
data = data.squeeze()
data.index = pd.to_datetime(data.index)

# apply function to calculate difference between datapoint over a period of 1 day
hour_count_default_threshold = datapoint_diff_over_time_period(data, pd.Timedelta("1D"), 24, pd.Timedelta("1h"))

# Resample and forward fill generated step series
resampled_step_series_default_threshold = hour_count_default_threshold.resample("60min")
default_threshold_forward_filled = resampled_step_series_default_threshold.ffill()

# Plot unchanged signal identification series against actual data
fig, ax1 = plt.subplots(figsize=(15, 5))
ax1.plot(data.index, data, label="Time series", marker=".", color="blue")

values = pd.date_range(data.index[0], data.index[-1], freq="120min")

ax1.set_xticks(values)
ax1.set_xticklabels([ts.strftime("%d-%m \n %H:%M") for ts in values], fontsize=8)

ax2 = ax1.twinx()
ax2.plot(
    data.index,
    default_threshold_forward_filled,
    label="Threshold breach indicator for datapoint diff over last 24 hours",
    marker=".",
    color="red",
)

lines1, labels1 = ax1.get_legend_handles_labels()
lines2, labels2 = ax2.get_legend_handles_labels()
ax2.legend(lines1 + lines2, labels1 + labels2, loc=0)

plt.xlabel("Timestamp")
ax1.set_ylabel("Timeseries value")
ax2.set_ylabel("Hour count threshold breach")

fig.suptitle(
    "Check if difference between two datapoints at a distance of 24 hours exceeds the threshold",
    fontsize=14,
)
fig.tight_layout()

plt.show()
Total running time of the script: (0 minutes 0.218 seconds)