Note
Go to the end to download the full example code.
Univariate Polynomial
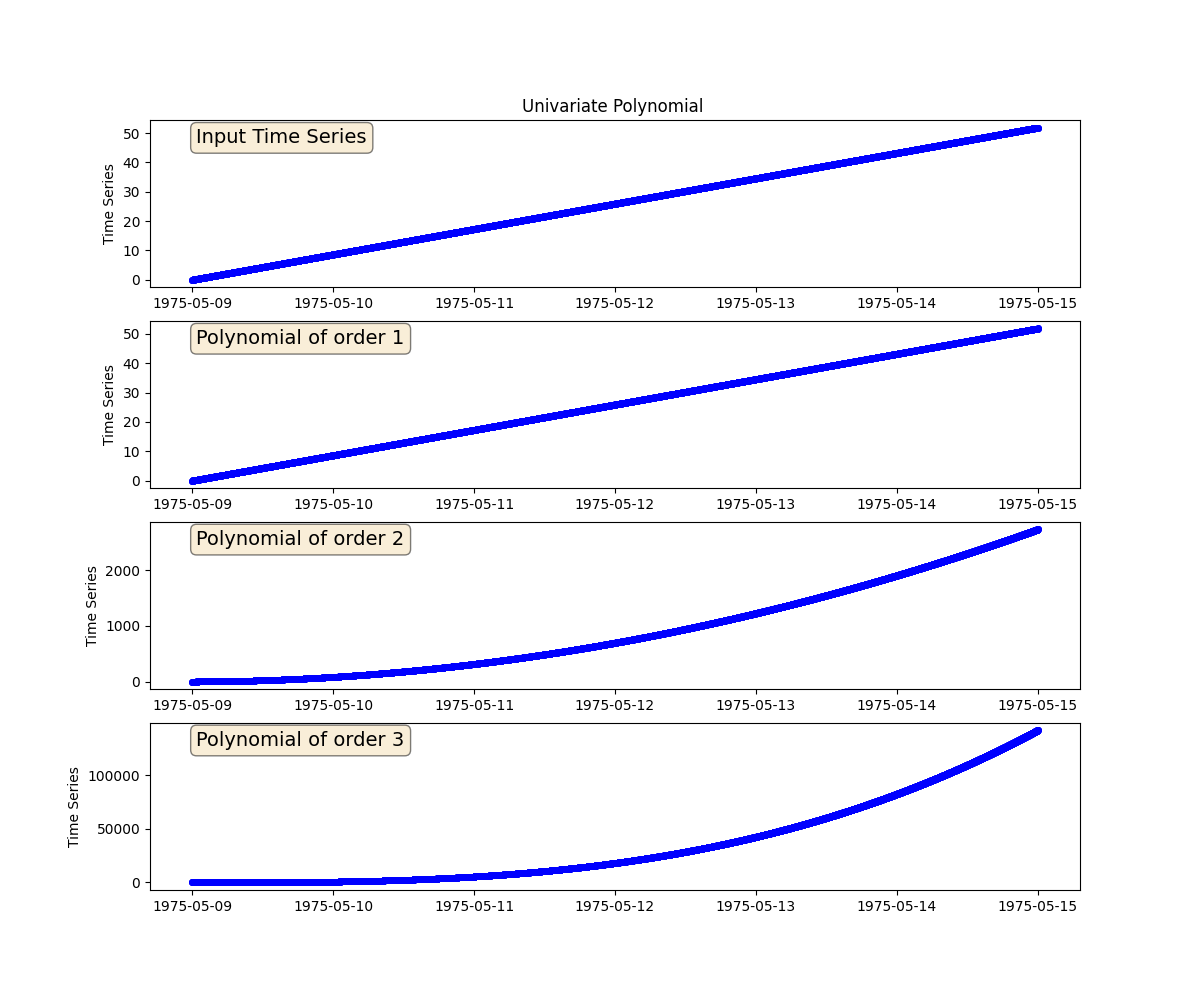
We will generate three univariate polynomials of a given time series. The order of the polynomials will be 1, 2 and 3, respectively.

import matplotlib.pyplot as plt
import pandas as pd

from indsl.signals.generator import line
from indsl.signals.polynomial import univariate_polynomial


start = pd.Timestamp("1975/05/09")
end = pd.Timestamp("1975/05/15")

# Create a time series

data = line(start_date=start, end_date=end, slope=1e-4, intercept=0)
coefficients_1 = [0, 1]
coefficients_2 = [0, 1, 1]
coefficients_3 = [0, 1, 1, 1]

fig, (ax1, ax2, ax3, ax4) = plt.subplots(4, 1, figsize=(12, 10))
props = dict(boxstyle="round", facecolor="wheat", alpha=0.5)

ax1.plot(data, "bo", mec="b", markerfacecolor="None", markersize=4)
ax1.text(
    0.05,
    0.95,
    "Input Time Series",
    transform=ax1.transAxes,
    fontsize=14,
    verticalalignment="top",
    bbox=props,
)
ax1.set_ylabel("Time Series")
ax1.set_title("Univariate Polynomial ")


ax2.plot(univariate_polynomial(data, coefficients_1), "bo", mec="b", markerfacecolor="None", markersize=4)
ax2.text(
    0.05,
    0.95,
    "Polynomial of order 1",
    transform=ax2.transAxes,
    fontsize=14,
    verticalalignment="top",
    bbox=props,
)
ax2.set_ylabel("Time Series")


ax3.plot(univariate_polynomial(data, coefficients_2), "bo", mec="b", markerfacecolor="None", markersize=4)
ax3.text(
    0.05,
    0.95,
    "Polynomial of order 2",
    transform=ax3.transAxes,
    fontsize=14,
    verticalalignment="top",
    bbox=props,
)
ax3.set_ylabel("Time Series")

ax4.plot(univariate_polynomial(data, coefficients_3), "bo", mec="b", markerfacecolor="None", markersize=4)
ax4.text(
    0.05,
    0.95,
    "Polynomial of order 3",
    transform=ax4.transAxes,
    fontsize=14,
    verticalalignment="top",
    bbox=props,
)
ax4.set_ylabel("Time Series")


plt.show()
Total running time of the script: (0 minutes 0.362 seconds)