Note
Go to the end to download the full example code.
Calculate parameters of a centrifugal pump
Calculate pump parameters total head across the pump and difference from Best Efficiency Point (BEP) to current operating flowrate and power output of a centrifugal pump.
from pathlib import Path

import matplotlib.pyplot as plt
import numpy as np
import pandas as pd

from indsl.equipment.pump_parameters import percent_BEP_flowrate, pump_hydraulic_power, pump_shaft_power, total_head


base_path = Path(__file__).parents[2] if "__file__" in globals() else next(p for p in (Path.cwd(), *Path.cwd().parents) if (p / "datasets").exists())
df = pd.read_pickle(base_path / "datasets" / "data" / "pump_data.pkl")
df_pump_curve = pd.read_csv(base_path / "datasets" / "data" / "pump_curve.csv")
First we need to define a few pump and fluid parameters: density of the fluid, Best Efficiency Point (BEP), efficiency parameters (polynomial coefficients of a 2nd order polynomial representing the pump efficiency curve), and discharge and suction pressure.
den = pd.Series(np.repeat(1100, len(df)))
BEP = pd.Series(np.repeat(100, len(df)))
eff_parameter_1 = pd.Series(np.repeat(-8.00781603e-06, len(df)))
eff_parameter_2 = pd.Series(np.repeat(5.19564490e-02, len(df)))
eff_intercept = pd.Series(np.repeat(3.89930657e00, len(df)))
df["discharge"] *= 100000
df["suction"] *= 100000
The coeffients of the pump efficiency curve can be obtained by fitting a second order polynomial through the efficiency vs liquid flowrate datapoints as shown below.
poly = np.polyfit(df_pump_curve.iloc[:, 0], df_pump_curve.iloc[:, 1], deg=2)
plt.scatter(df_pump_curve.iloc[:, 0], df_pump_curve.iloc[:, 1])
plt.xlabel("Liquid flowrate [m3/h]")
plt.ylabel("Pump efficiency [%]")
plt.plot(df_pump_curve.iloc[:, 0], np.polyval(poly, df_pump_curve.iloc[:, 0]), label="fit", color="orange")
plt.text(2000, 10, f"{poly[0]:.6f}x^2 + {poly[1]:.2f}x + {poly[2]:.2f}")
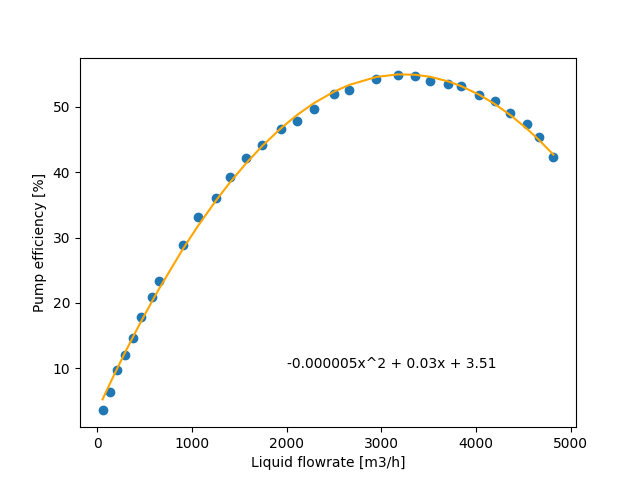
Text(2000, 10, '-0.000005x^2 + 0.03x + 3.51')
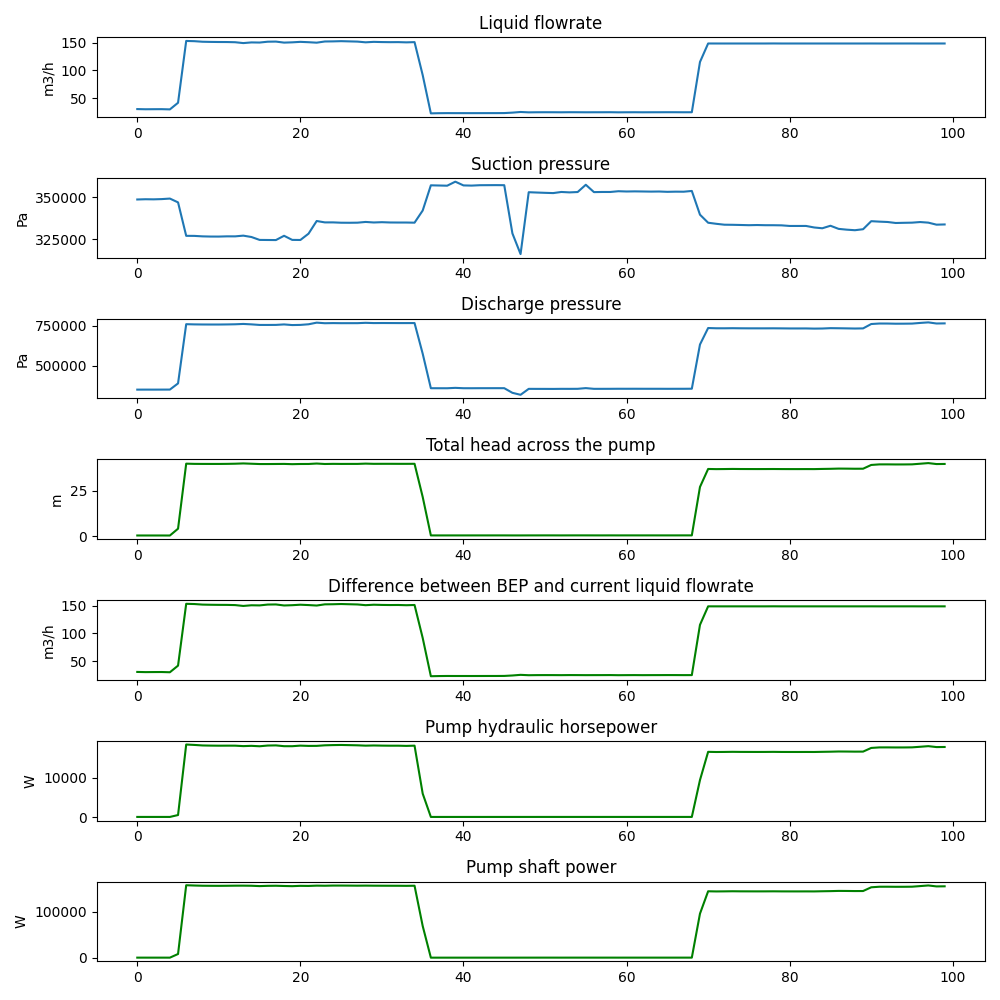
Plug the above values to the pump parameter functions and display the results.
df["total_head"] = total_head(df["discharge"], df["suction"], den, align_timesteps=True)
df["BEP_flowrate"] = percent_BEP_flowrate(df["flowrate"], BEP, align_timesteps=True)
df["pump_hydraulic_power"] = pump_hydraulic_power(df["flowrate"] / 3600, df["total_head"], den, align_timesteps=True)
df["pump_shaft_power"] = pump_shaft_power(
    df["pump_hydraulic_power"], df["flowrate"], eff_parameter_1, eff_parameter_2, eff_intercept, align_timesteps=True
)

fig, ax = plt.subplots(nrows=7, ncols=1, figsize=(10, 10))
ax[0].plot(df["flowrate"])
ax[0].set_ylabel("m3/h")
ax[0].set_title("Liquid flowrate")
ax[1].plot(df["suction"])
ax[1].set_title("Suction pressure")
ax[1].set_ylabel("Pa")
ax[2].plot(df["discharge"])
ax[2].set_title("Discharge pressure")
ax[2].set_ylabel("Pa")
ax[3].plot(df["total_head"], color="green")
ax[3].set_title("Total head across the pump")
ax[3].set_ylabel("m")
ax[4].plot(df["BEP_flowrate"], color="green")
ax[4].set_title("Difference between BEP and current liquid flowrate")
ax[4].set_ylabel("m3/h")
ax[5].plot(df["pump_hydraulic_power"], color="green")
ax[5].set_title("Pump hydraulic horsepower")
ax[5].set_ylabel("W")
ax[6].plot(df["pump_shaft_power"], color="green")
ax[6].set_title("Pump shaft power")
ax[6].set_ylabel("W")

plt.tight_layout()
plt.show()
Total running time of the script: (0 minutes 0.507 seconds)