Note
Click here to download the full example code
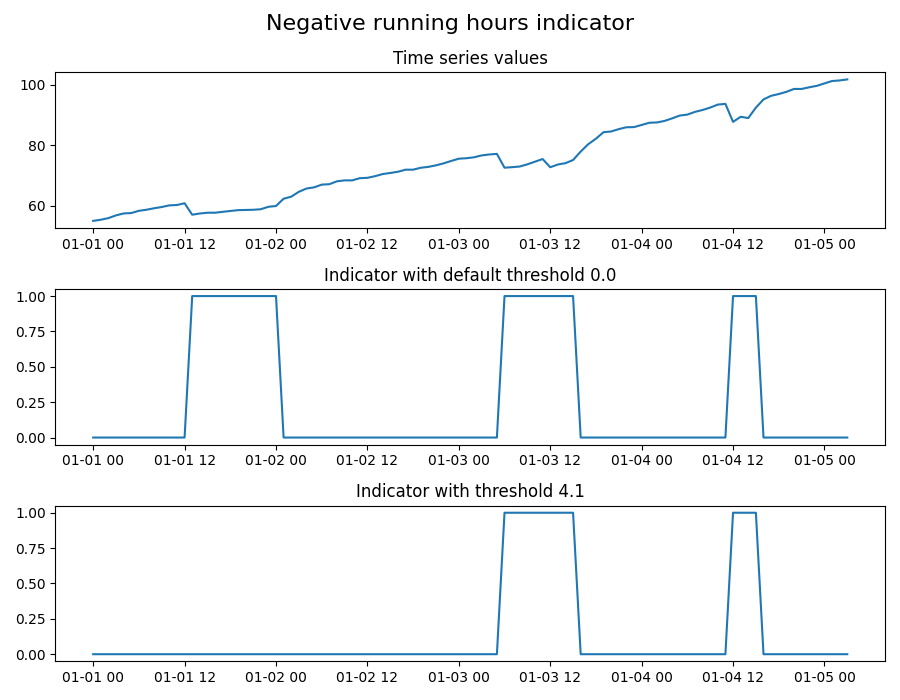
Negative running hours detection
Example of algorithm that indicates decrease in time series data. Algorithm is applied on Running Hours time series. It is a specific type of time series that is counting the number of running hours in a pump. Given that we expect the number of running hours to either stay the same (if the pump is not running) or increase with time (if the pump is running), the decrease in running hours value indicates bad data quality.
The output of the algorithm is an indicator time series with value 1 where there is a decrease in time series value, and 0 otherwise. The indicator will be set to 1 until the data gets “back to normal” (that is, until time series reaches the value it had before the value drop).
The algorithm is applied on the same data twice:
Using default threshold; indicator will be set to 1 if data drop is higher than 0
Using a threshold of 4.1; indicator will be set to 1 if data drop is higher than 4.1
import os

import matplotlib.pyplot as plt
import pandas as pd

from indsl.data_quality.negative_running_hours import negative_running_hours_check


# import generated data
base_path = "" if __name__ == "__main__" else os.path.dirname(__file__)
data = pd.read_csv(os.path.join(base_path, "../../datasets/data/negative_running_hours_data.csv"), index_col=0)
data = data.squeeze()
data.index = pd.to_datetime(data.index)

# apply the negative running hours function - use default threshold (0.0)
indicator_default_threshold = negative_running_hours_check(data)

# apply the negative running hours function - change the threshold (4.1)
indicator_new_threshold = negative_running_hours_check(data, 4.1)

# plot the results
fig, (ax1, ax2, ax3) = plt.subplots(3, 1, figsize=(9, 7))
ax1.plot(data, "-")
ax2.plot(indicator_default_threshold, "-")
ax3.plot(indicator_new_threshold, "-")
ax1.set_title("Time series values")
ax2.set_title("Indicator with default threshold 0.0")
ax3.set_title("Indicator with threshold 4.1")
fig.suptitle("Negative running hours indicator", fontsize=16)
fig.tight_layout()

plt.show()
Total running time of the script: ( 0 minutes 1.731 seconds)